Time Series and Machine Learning Approach for Weather Forecasting

Weather Forecasting Project

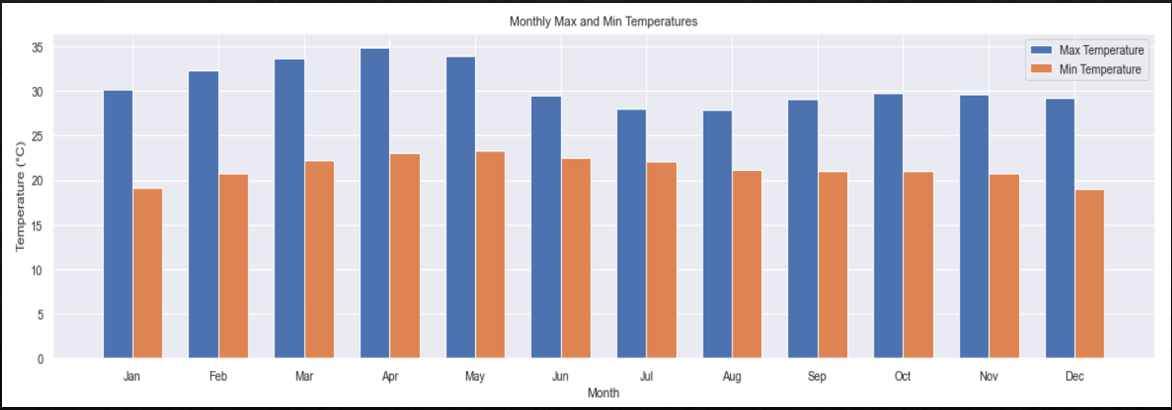
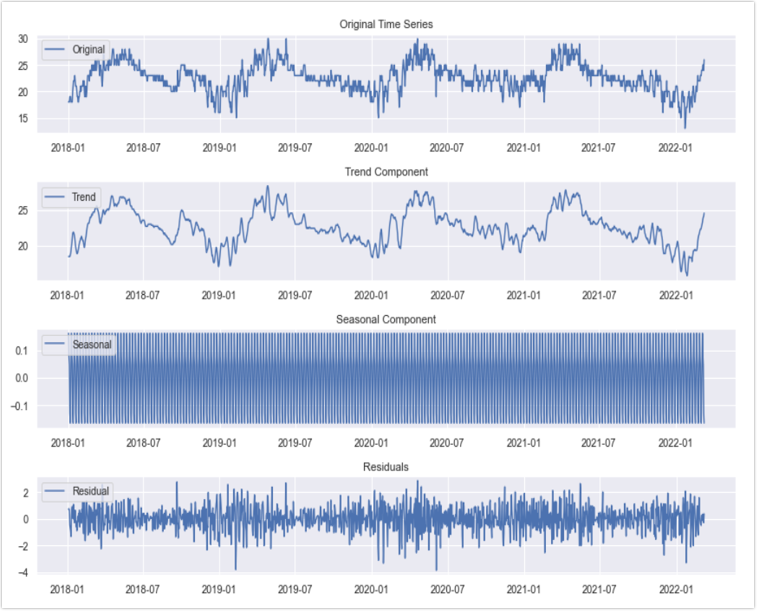
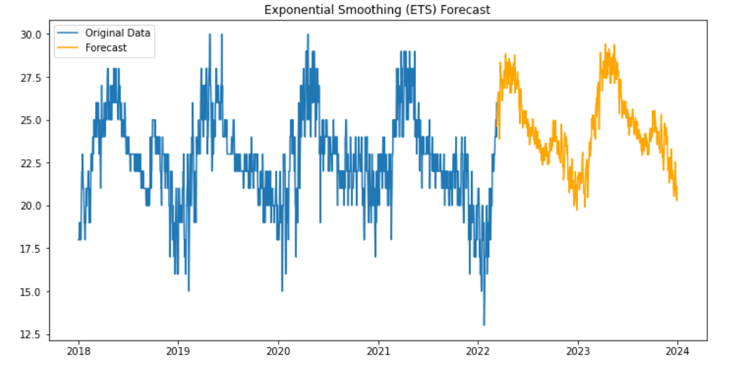
In this project, our goal is to analyze and forecast the temperature of Pune city using time series modeling and machine learning techniques. Specifically, we aim to study the trend patterns in the weather dataset, identify seasonal variations, and fit appropriate time series models. By doing so, we intend to generate forecasts that capture both trend and seasonality. Additionally, we will compare the performance of different time series models to determine the most accurate and reliable approach for temperature prediction. This work has practical implications for urban planning, agriculture, and daily life, helping to better anticipate and respond to weather changes in Pune.

The Steps I Took

  • Collected historical weather data from Kaggle.
  • Processed and cleaned the data for analysis.
  • Conducted exploratory data analysis (EDA).
  • Created visualizations for temperatures, rainfall, correlations, ACF/PACF, and seasonal decomposition.
  • Fitted SARIMA, Exponential Smoothing, and ARIMA models.
  • Compared models using AIC, BIC, MSE, RMSE, and MAE metrics.
  • Determined Exponential Smoothing model as best for forecasting.

Why I Took These Steps

  • Ensured reliable data for analysis.
  • Prepared the data for accurate model training.
  • Identified patterns and trends in the data.
  • Visualized key data insights for better understanding.
  • Applied various statistical models for comparison.
  • Evaluated model performance for accuracy.
  • Selected the most accurate forecasting model.

Tools I Used

  • R Software R Software
  • Python Python
  • Tableau Tableau

Challenges:

Here are some of my wonderful visuals from this project:

Bar Graph of monthly average maximum and minimum temperature

Bar Graph of Monthly Average Temperature

Bar Plot of Monthly Average Rainfall

Bar Plot of Monthly Average Rainfall

Correlation Heatmap

Correlation Heatmap

Autocorrelation Function (ACF)

Autocorrelation Function (ACF)

Partial Autocorrelation Function (PACF)

Partial Autocorrelation Function (PACF)

Seasonal Decomposition

Seasonal Decomposition

Results:

  1. The analysis of weather data revealed distinct seasonal patterns and variations:
    • The average maximum temperature peaks in April and May.
    • The average minimum temperature drops to its lowest in December and January.
    • Rainfall follows a seasonal trend, with peak rainfall in July and lowest in January.
  2. The Exponential Smoothing model is the optimal choice for this dataset, excelling in MSE, RMSE, and MAE metrics. It also shows superior AIC and BIC values, making it a simple yet effective model. Its ease of implementation and accurate forecasting capabilities further validate its suitability.
    Forecasted Values

    The blue line represents the original temperature data, and the orange line represents the forecasted values of temperature for the next 365 days (1 Year).

  3. Using the Exponential Smoothing model, we forecast the temperature for the next 2 days (48 Hours).
    Temperature Forecast